maprese
Giriş yap Ücretsiz başlayın

Harita tabanlı hikâye ve sunum aracı

Verinizi canlı bir harita sunumuna dönüştürün.

GPX rotası, KML, CSV, Shapefile ya da kendi çizimleriniz… Adım adım ilerleyen bir harita hikâyesi hazırlayın; linkle paylaşın, tam ekran sunun, PowerPoint/PDF indirin ya da web sitenize gömün.

Ücretsiz hesap açın ▶ İstanbul örneğini izleyin

Kurulum yok · Tarayıcıda çalışır · CBS bilgisi gerekmez
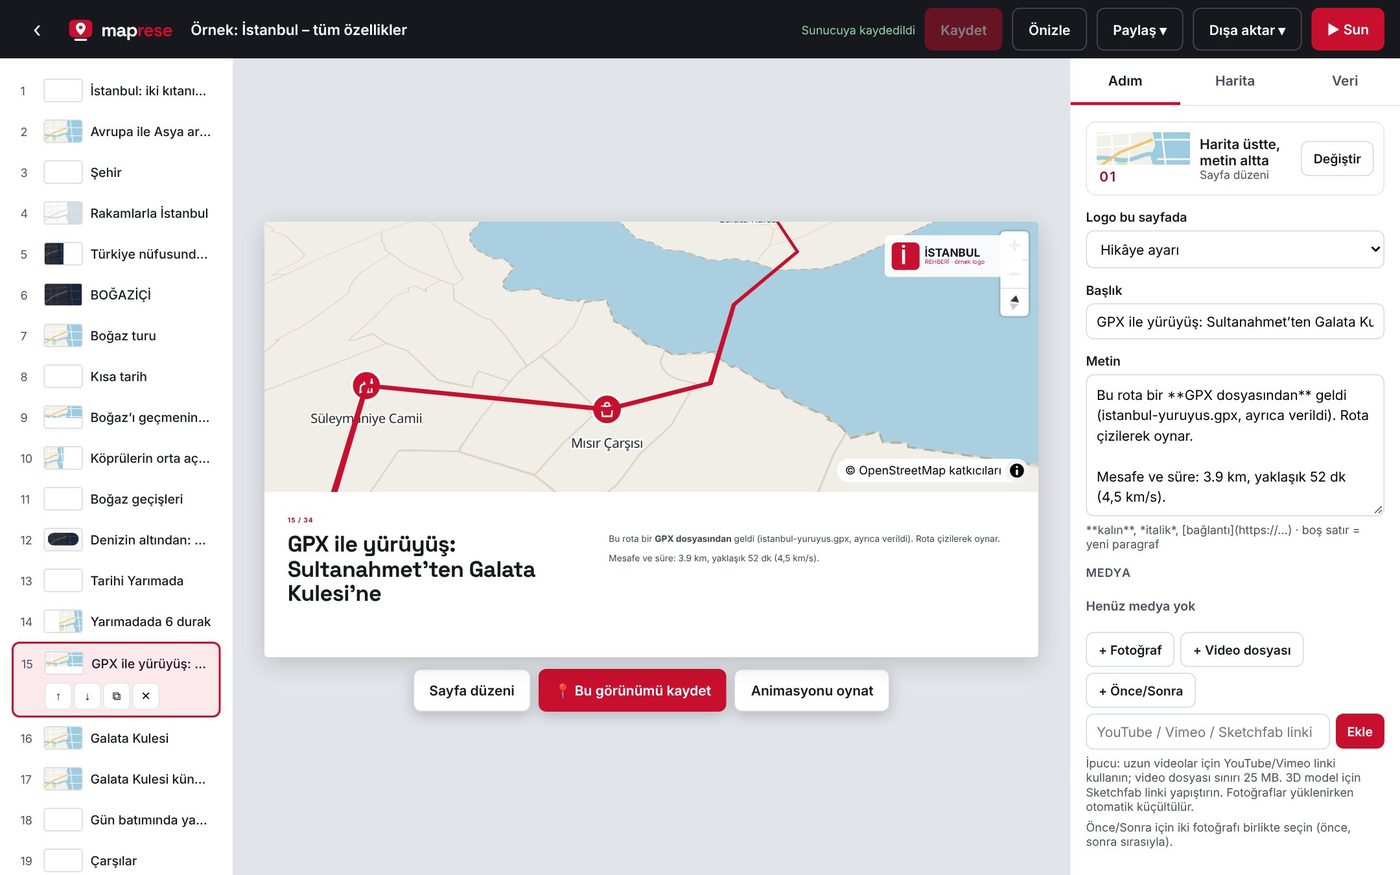
Maprese düzenleyicisi: solda adım listesi, ortada Sultanahmet’ten Galata’ya GPX yürüyüş rotası çizilmiş İstanbul haritası, sağda adım ayarları
Gerçek ekran: İstanbul örneği, 15. adım. Rota bir GPX dosyasından geliyor (3,9 km, ~52 dk).
Yükleyebildikleriniz: GPXKML / KMZGeoJSONCSV (enlem-boylam, X/Y)Shapefile (zip)TM27/30/33/36 · UTM · ED50Fotoğraf · Video360° panoramaXYZ / WMS servis

Harita ekran görüntüsünü slayta yapıştırma dönemi bitti.

Bir yeri anlatmak için haritadan ekran görüntüsü alıp sunuma yapıştırır, okları tek tek çizeriz. Maprese’de harita sunumun kendisidir: her sayfa kendi kamera açısını, katmanlarını ve animasyonunu hatırlar.
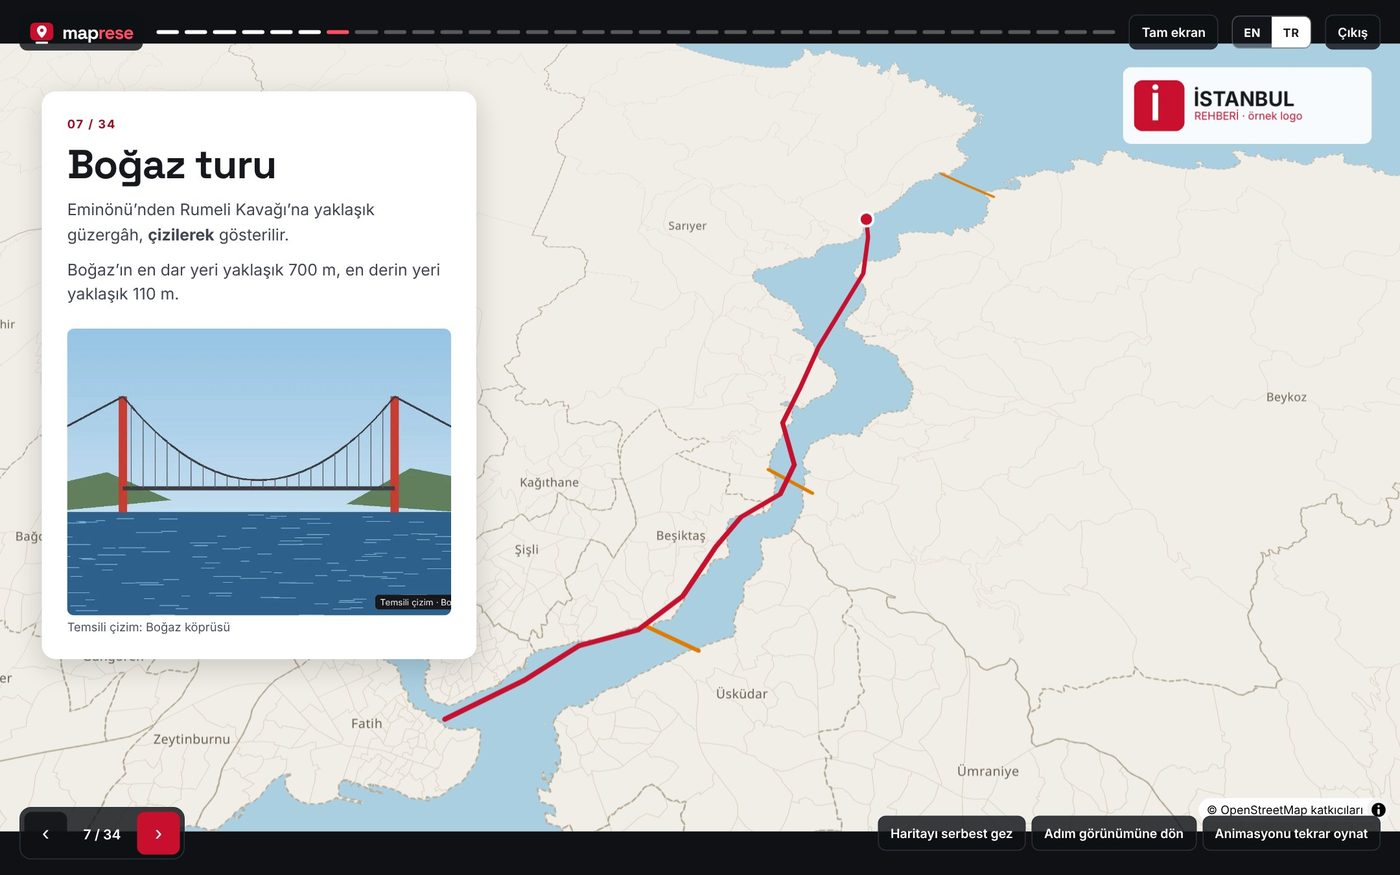
Sunum modunda Boğaz turu sayfası: Eminönü’nden Rumeli Kavağı’na çizilen vapur güzergâhı, köprüler ve bilgi kartı
Sunum modu: Boğaz turu güzergâhı ekranda çizilerek ilerliyor; köprüler turuncu çizgilerle işaretli.
1

Canlı harita, durağan görüntü değil

İzleyen yakınlaşır, katmanları görür, rotanın çizilişini izler. Aynı veri, her sayfada farklı açıdan.

2

CBS bilmeden

Dosyayı bırakın, koordinat sistemini seçin; TM30 ölçüm noktaları bile kendiliğinden haritaya oturur.

3

Bir kez hazırla, her yerde kullan

Link, tam ekran sunum, PowerPoint, PDF, web sitesine gömme ve tek dosya HTML: hepsi aynı hikâyeden.

NASIL ÇALIŞIR

Üç adımda harita sunumu
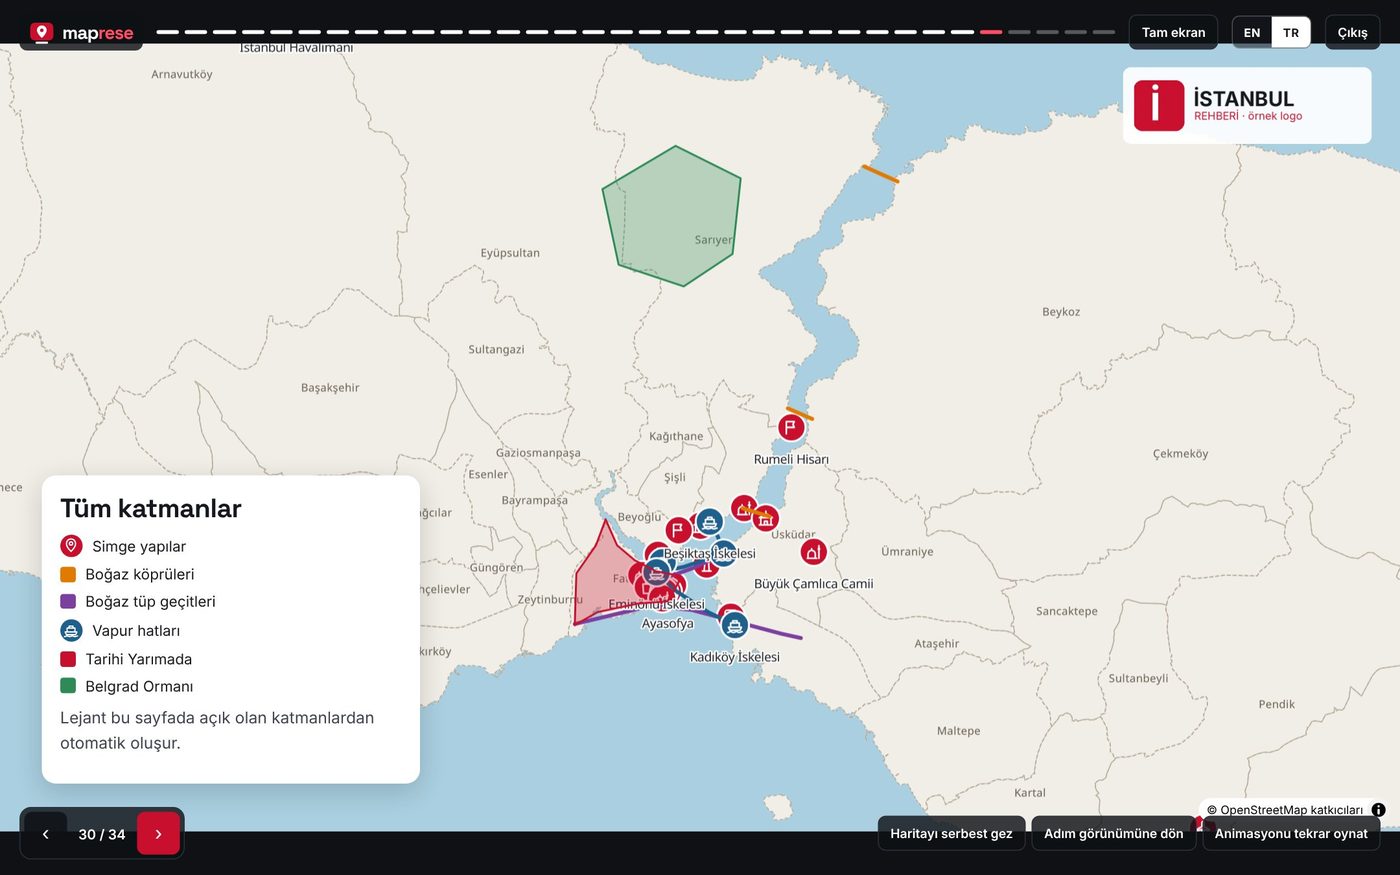
Birden çok veri katmanı ve otomatik lejant ile İstanbul haritası
1

Verinizi ekleyin

GPX, KML, CSV veya SHP dosyanızı bırakın ya da haritaya çizin. Lejant açık katmanlardan kendiliğinden oluşur.
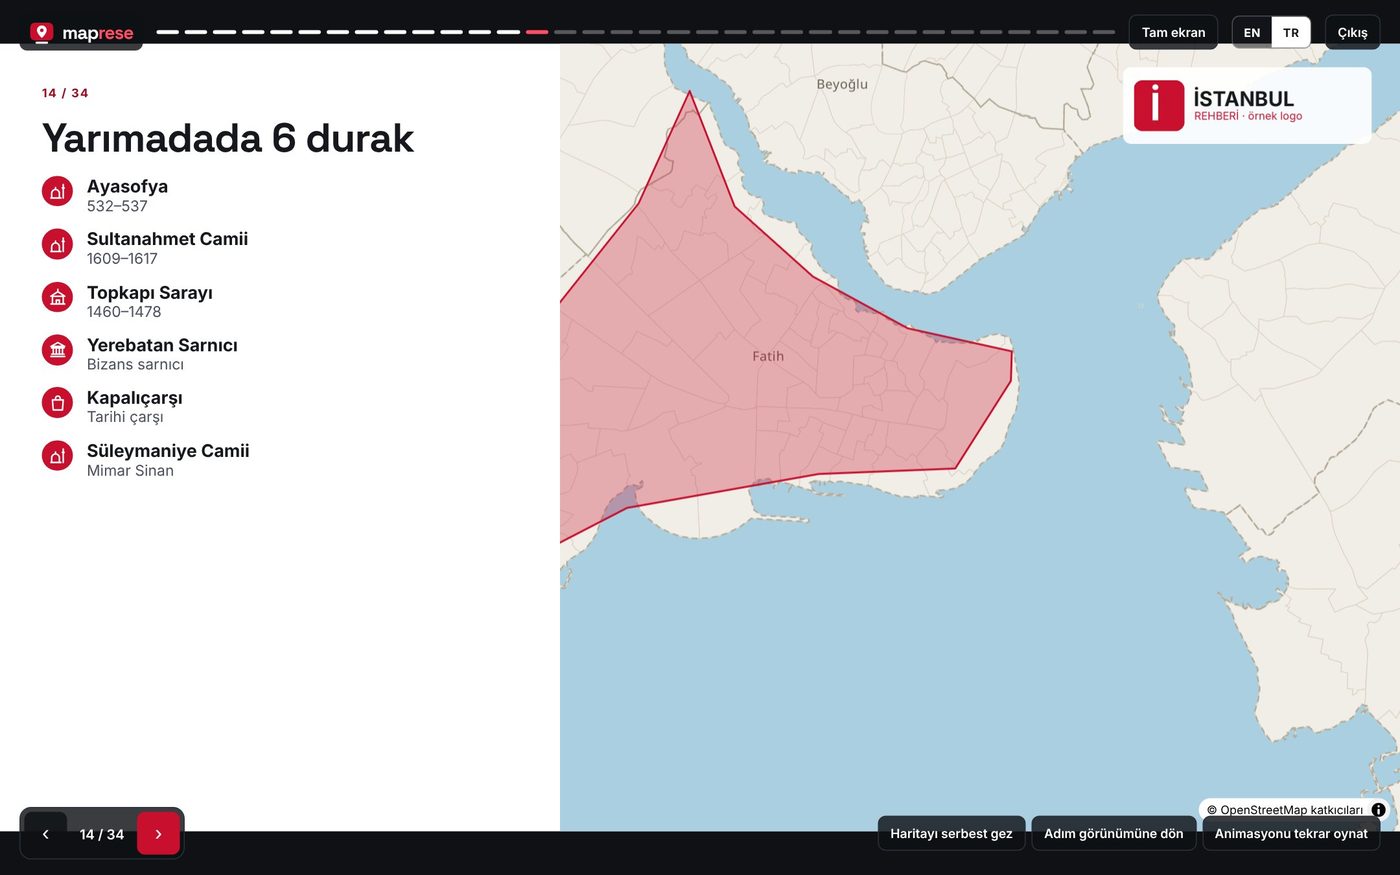
Numaralı liste ve harita düzeni: Tarihi Yarımada’da 6 durak
2

Sayfaları kurun

Her adım boş sayfayla başlar; 34 hazır düzenden birini seçin, kamera açısını kaydedin, animasyonu açın.
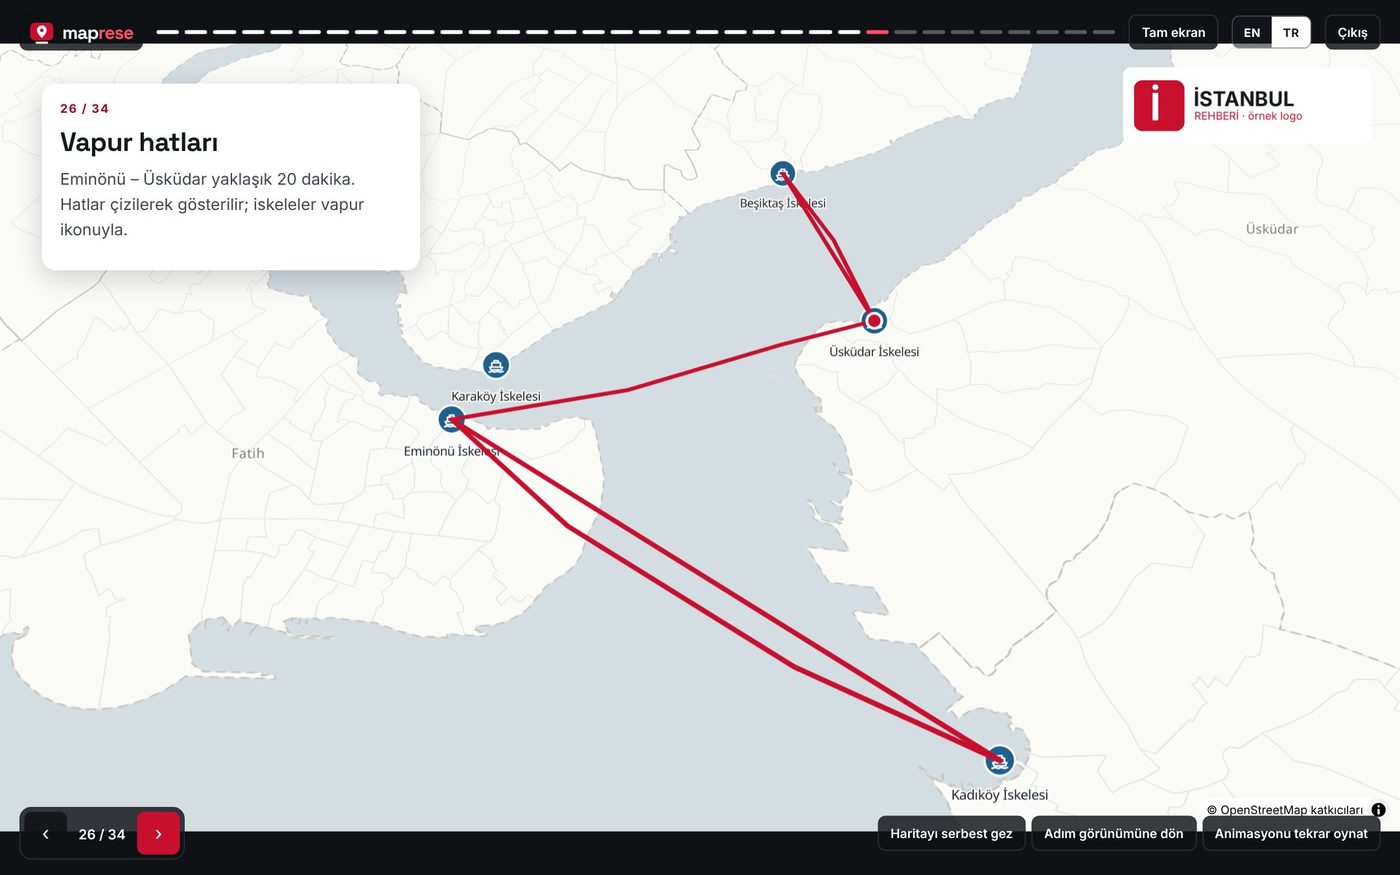
Vapur hatları sayfası: Eminönü, Karaköy, Kadıköy ve Üsküdar iskeleleri arasında hatlar
3

Paylaşın, sunun, indirin

Linki gönderin, toplantıda sunun, PowerPoint/PDF alın ya da kendi sitenize gömün.

TEK HİKÂYE, ALTI ÇIKTI

Nerede anlatacaksanız oraya uygun

Aynı hikâyeyi yeniden hazırlamazsınız: toplantıya sunum, müşteriye link, ihaleye PDF, web sitenize canlı harita.
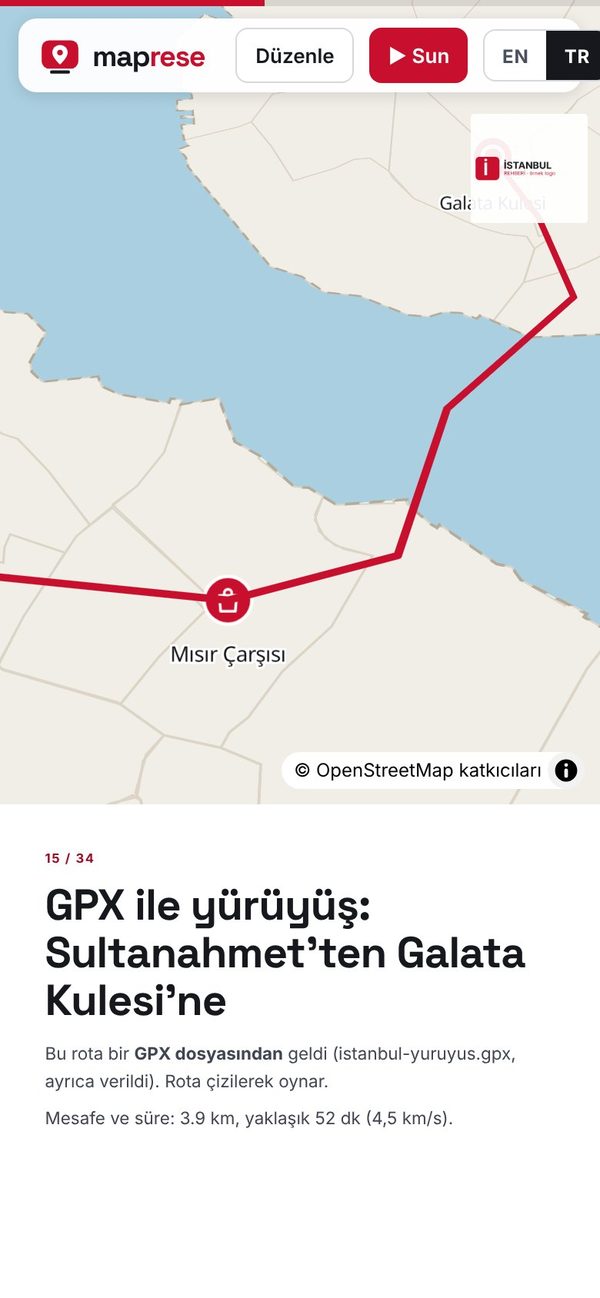
Telefonda kaydırarak izlenen GPX yürüyüşü

Canlı link

Kaydırdıkça ilerleyen harita hikâyesi; telefonda da çalışır. Açan kişi üye olmadan izler, değiştiremez.

Tam ekran sunumda BOĞAZİÇİ başlıklı koyu harita sayfası

Tam ekran sunum

Toplantıda ok tuşlarıyla ilerleyin; kamera uçar, rota çizilir, soruya göre haritayı serbestçe gezin.
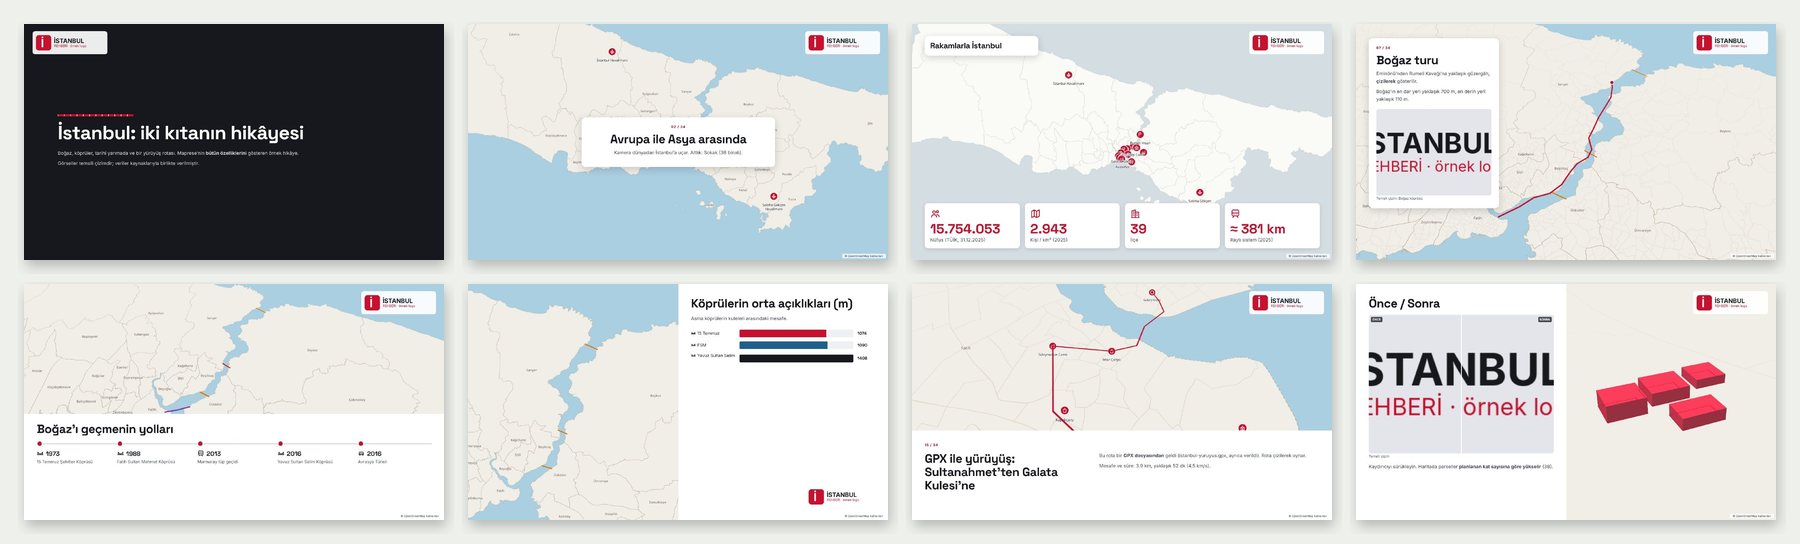
İstanbul örneğinin PDF çıktısından sekiz sayfa

PowerPoint ve PDF

Her adım bir slayt; metinler PowerPoint notlarına da yazılır. İhale dosyası, rapor eki, çıktı için.
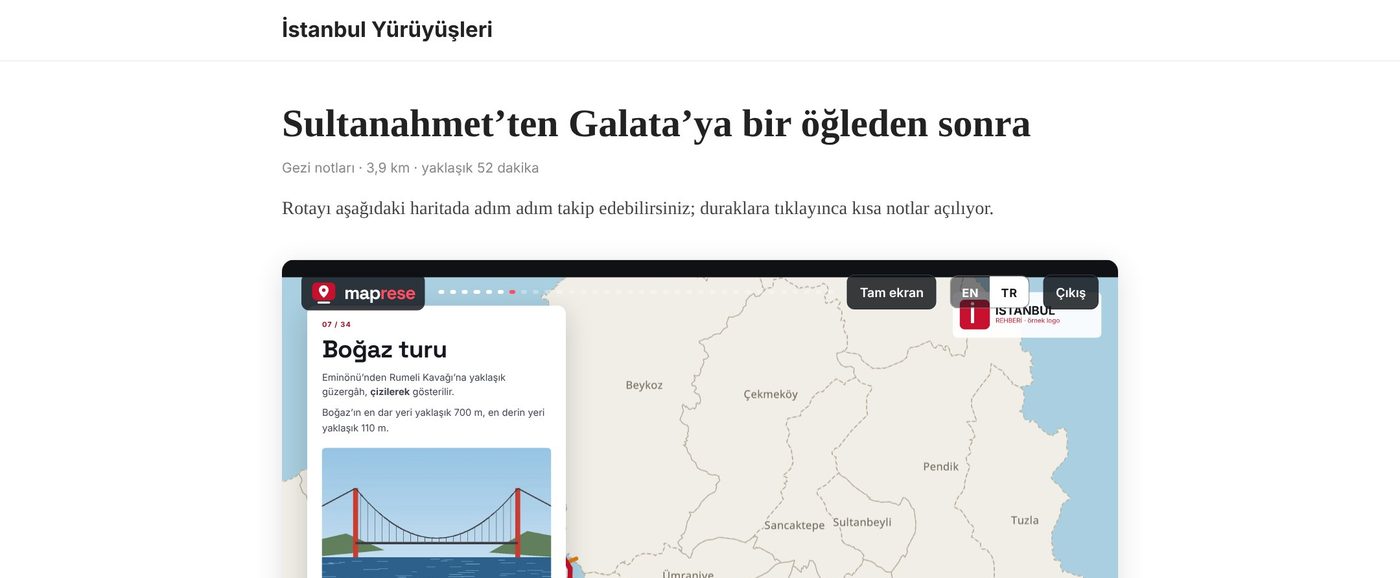
Bir gezi blogu yazısının içine gömülmüş Maprese haritası

Web sitenize gömün

Kodu sitenize, blogunuza, ilan sayfanıza yapıştırın; hikâyeyi güncelleyince sitedeki harita da güncellenir.

Avrupa ile Asya arasında başlıklı kapak sayfası

Tek dosya HTML

Fotoğraflar ve veriler içinde; kendi sunucunuza koyun veya e-postayla gönderin.

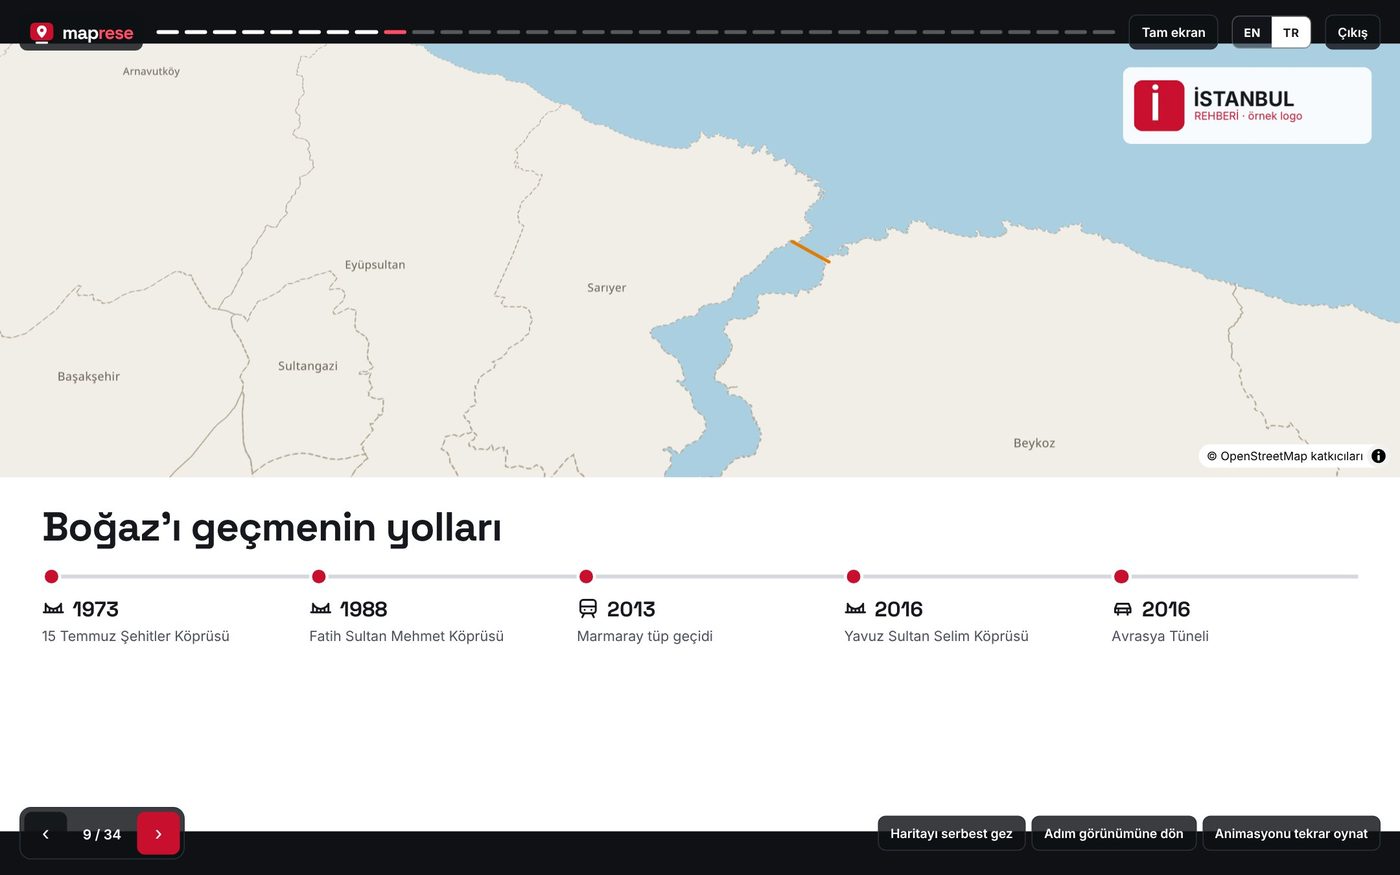
Boğaz geçişleri zaman çizelgesi sayfası

Ekran görüntüsü (PNG)

Her sayfayı görsel olarak indirin: sosyal medya, rapor kapağı, mesajlaşma.

Hangi çıktı ne zaman?

ÇıktıHarita hareketli mi?İnternet gerekir mi?En iyi kullanım
Canlı linkEvetEvetMüşteriye, ekibe, sosyal medyaya göndermek
Tam ekran sunumEvetEvetToplantı, sınıf, saha bilgilendirmesi
Siteye gömmeEvetEvetWeb sitesi, blog, proje tanıtım sayfası
HTML dosyasıEvetHarita altlığı için evetKendi sunucunuz, arşiv, hesapsız paylaşım
PowerPointHayır (görsel)HayırKurum sunumu, başka slaytlarla birleştirmek
PDFHayırHayırİhale, rapor eki, çıktı almak
PNG görselHayırHayırSosyal medya, kapak görseli, mesajlaşma

GERÇEK VERİLERLE

Haritanın yanında sayı, tablo ve grafik

Aşağıdaki sayfalar İstanbul örneğinden; veriler kaynaklarıyla birlikte. Kendi tablonuzu yazın, sayfa düzeni gerisini yapar.
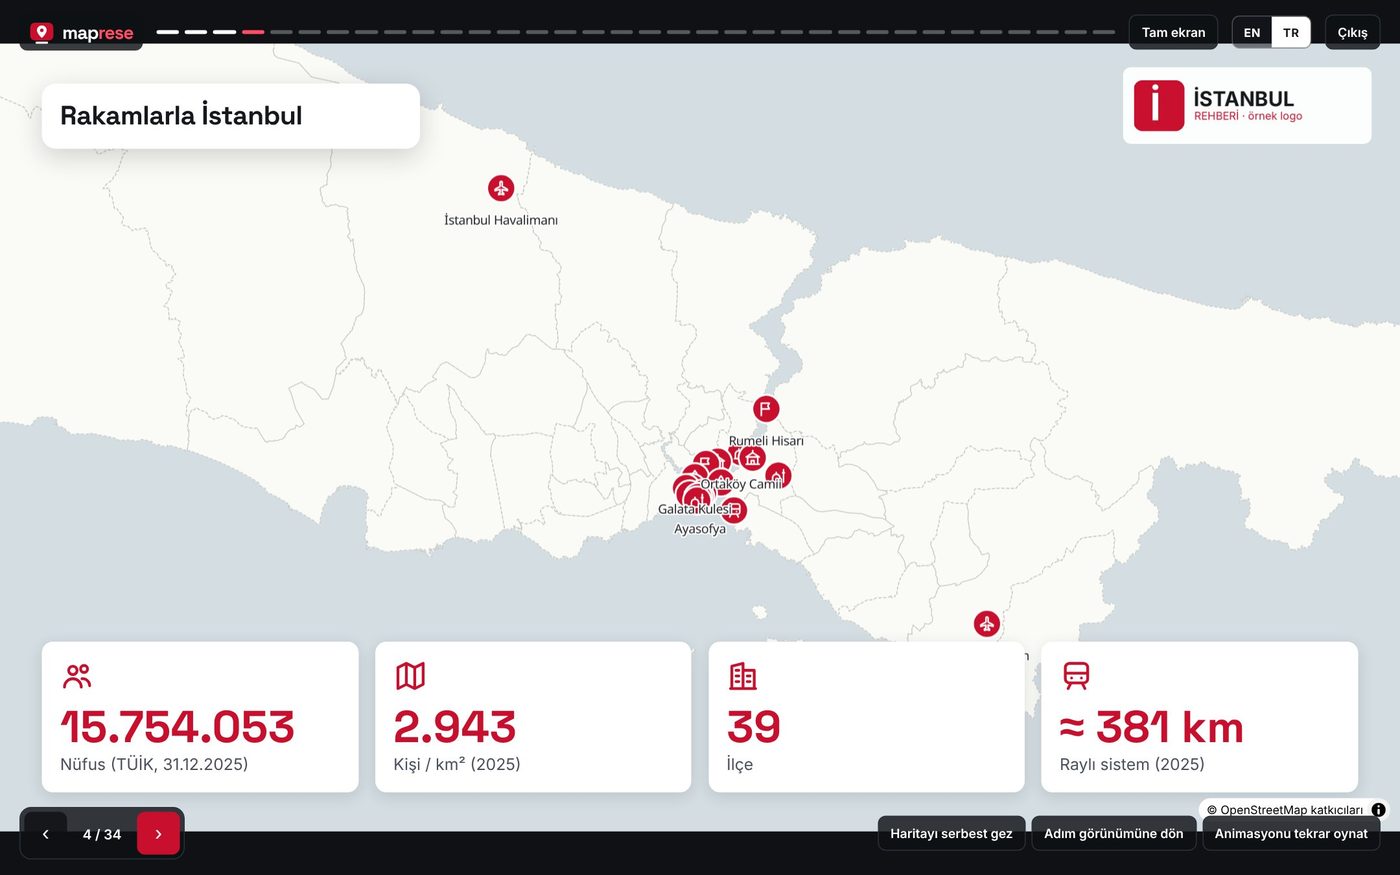
Rakamlarla İstanbul: 15.754.053 nüfus, km² başına 2.943 kişi, 39 ilçe, yaklaşık 381 km raylı sistem
İstatistik kartları + haritaNüfus 15.754.053 ve km² başına 2.943 kişi (TÜİK ADNKS, 31.12.2025), 39 ilçe, ~381 km raylı sistem (2025).
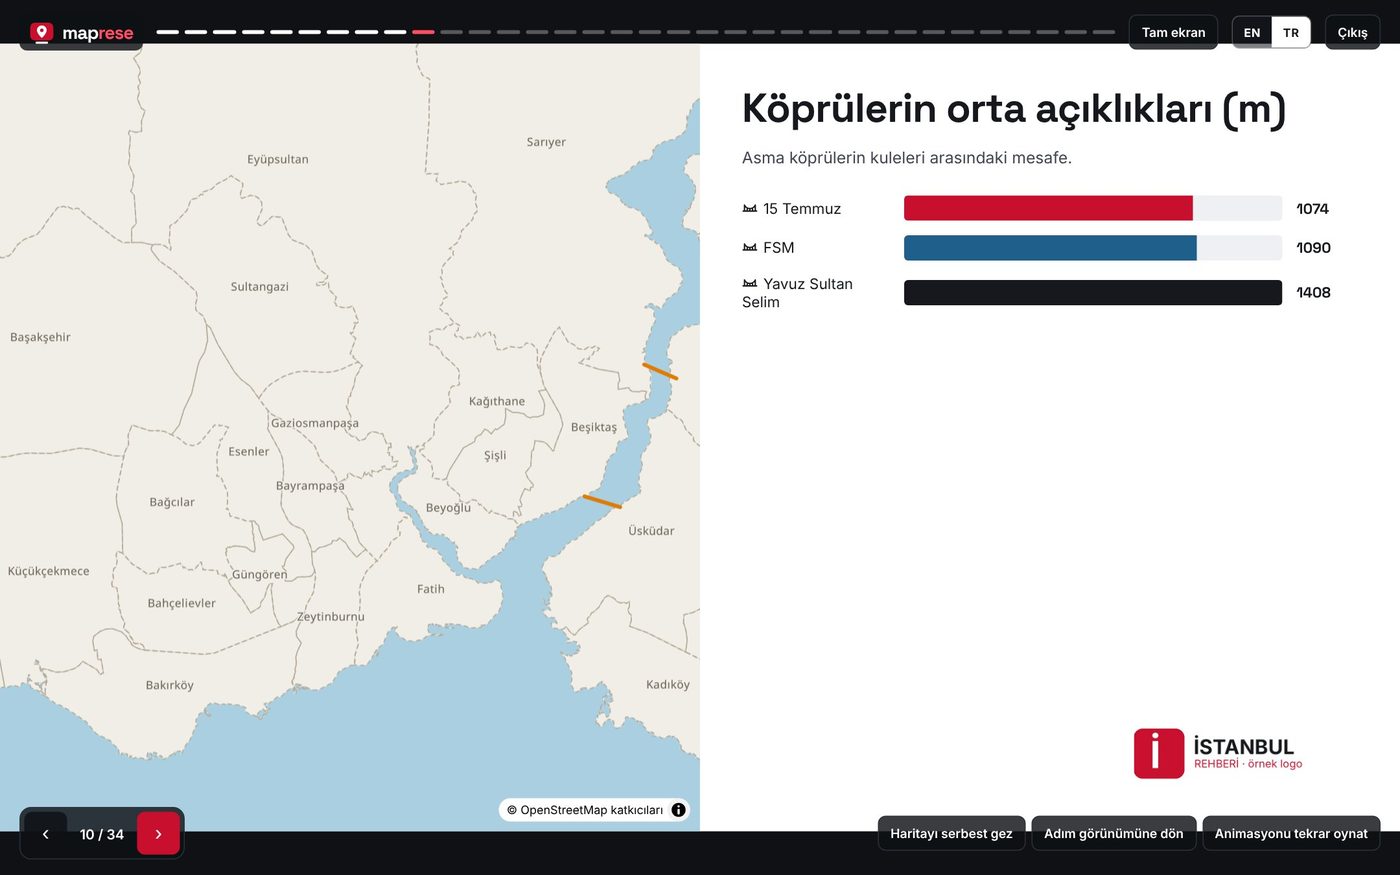
Köprülerin orta açıklıkları çubuk grafiği: 1.074, 1.090 ve 1.408 metre
Çubuk grafik + haritaBoğaz köprülerinin orta açıklıkları: 1.074 m, 1.090 m, 1.408 m.
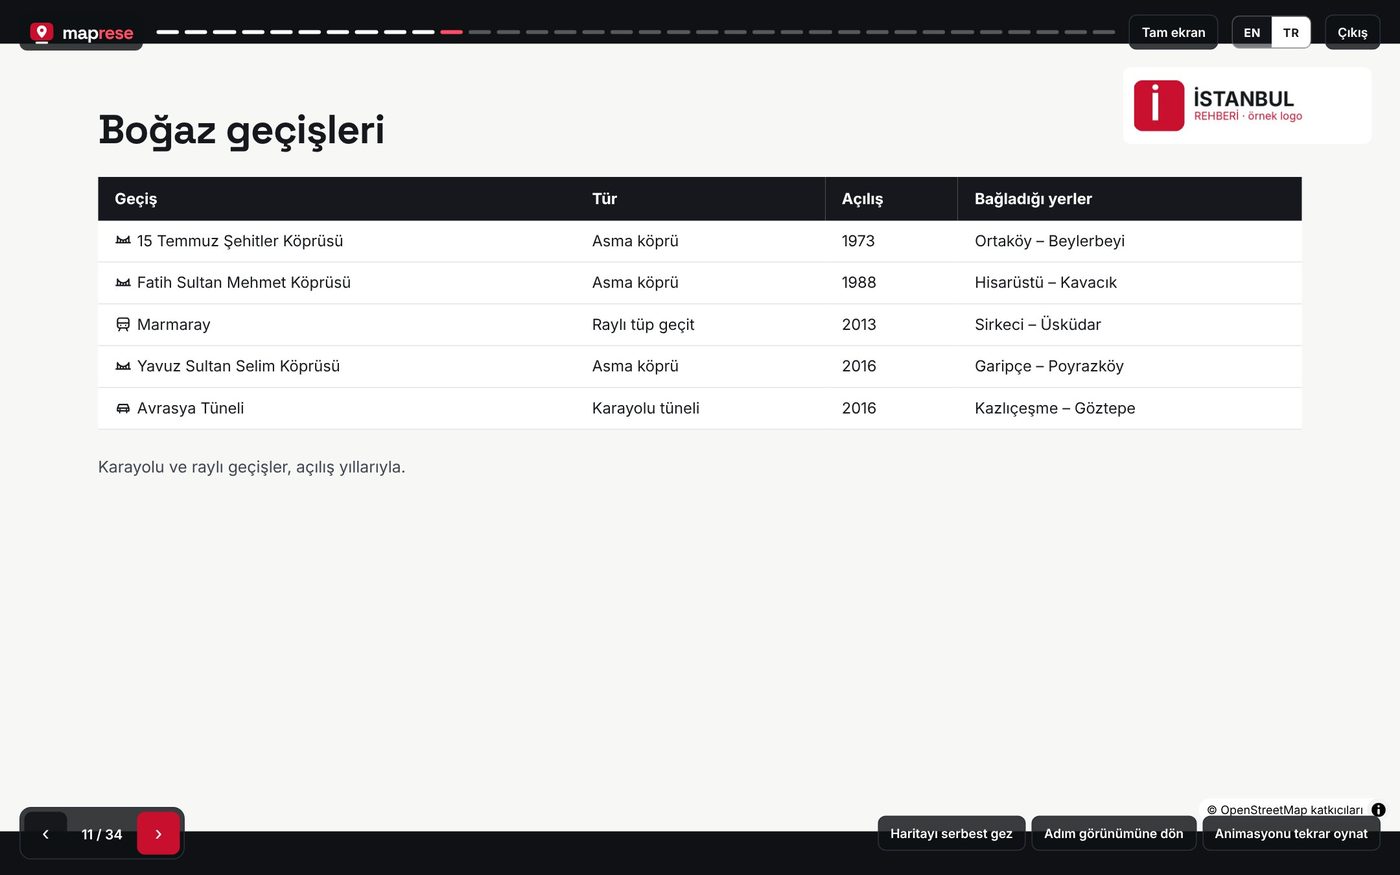
Boğaz geçişleri tablosu: köprüler, Marmaray ve Avrasya Tüneli
TabloBeş Boğaz geçişi: tür, açılış yılı ve bağladığı yerler; satırlarda ikonlar.
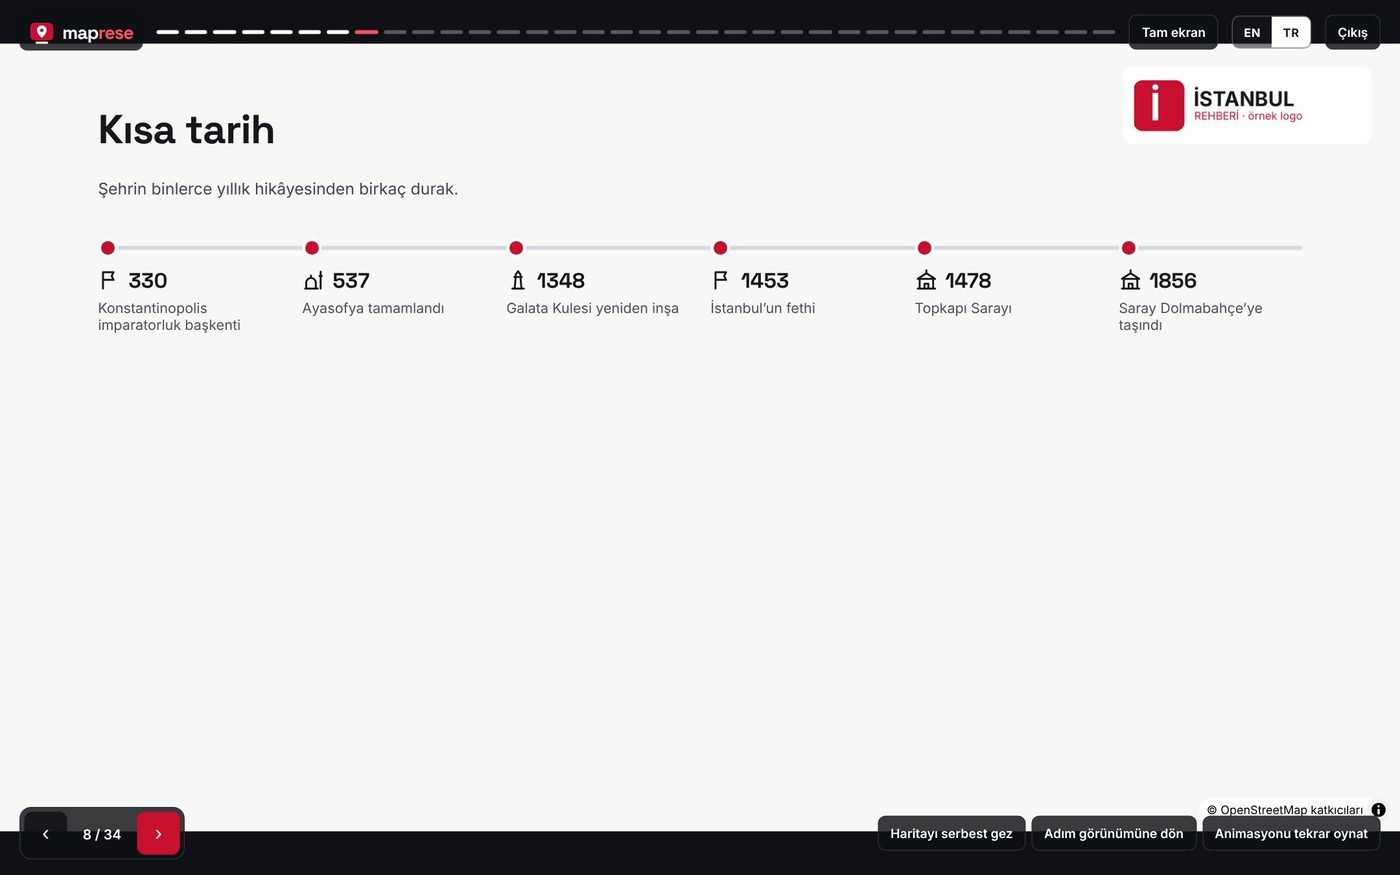
Kısa tarih zaman çizelgesi: 330’dan 1856’ya
Zaman çizelgesi330 başkent, 537 Ayasofya, 1453 fetih, 1478 Topkapı, 1856 Dolmabahçe.
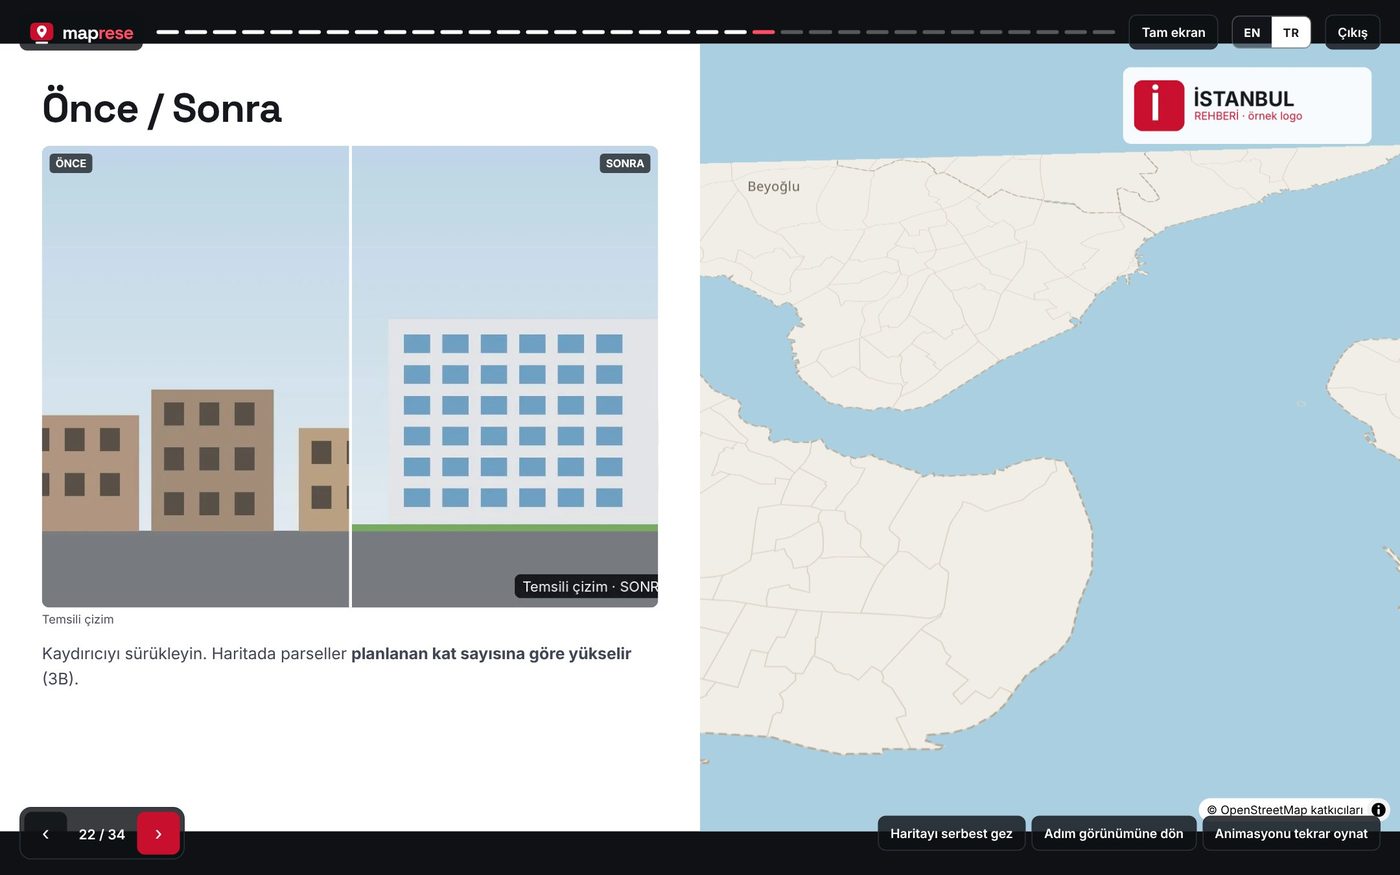
Önce/sonra kaydırıcısı ve 3B yükseltilmiş örnek parseller
Önce / sonra + 3B parselKaydırıcıyla mevcut ve planlanan durum; parseller kat sayısına göre yükselir (örnek veri).
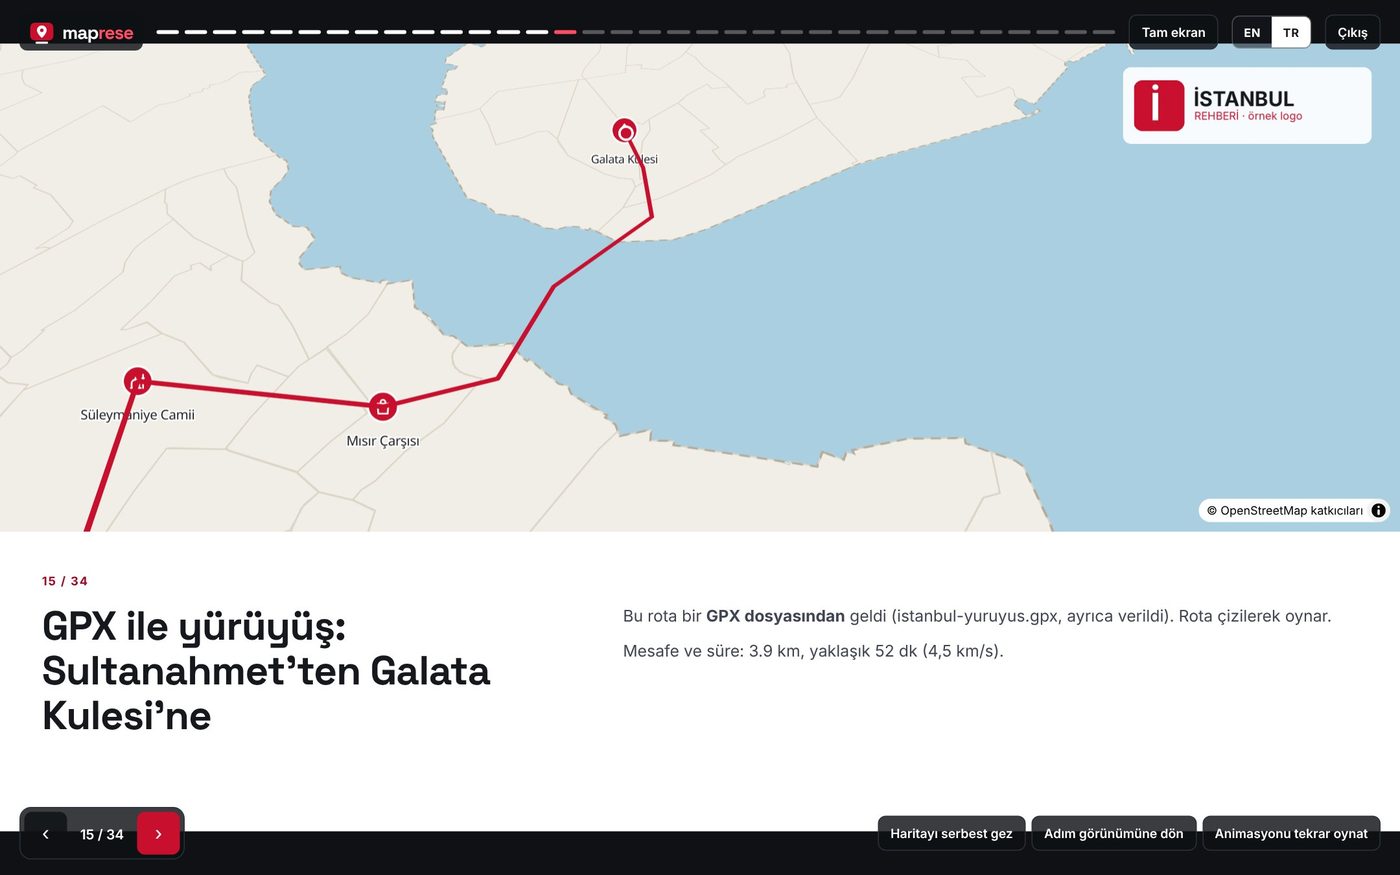
Harita üstte, metin altta: Sultanahmet’ten Galata Kulesi’ne GPX yürüyüşü
GPX rotasıGerçek yürüyüş izi: 3,9 km, yaklaşık 52 dakika; rota sayfa açılınca çizilir.

360° SAHA FOTOĞRAFI

Sahayı ofise getirin: 360° fotoğrafın üstüne çizin

360 kamerayla veya telefonun panorama moduyla çektiğiniz fotoğrafı bir sunum sayfasına dönüştürün. Parsel sınırını, ölçüm noktalarını, hatları ve uyarıları doğrudan fotoğrafın üstüne işleyin; izleyen kişi fareyle etrafa bakar, noktalara tıklayıp bilgi kartlarını açar.
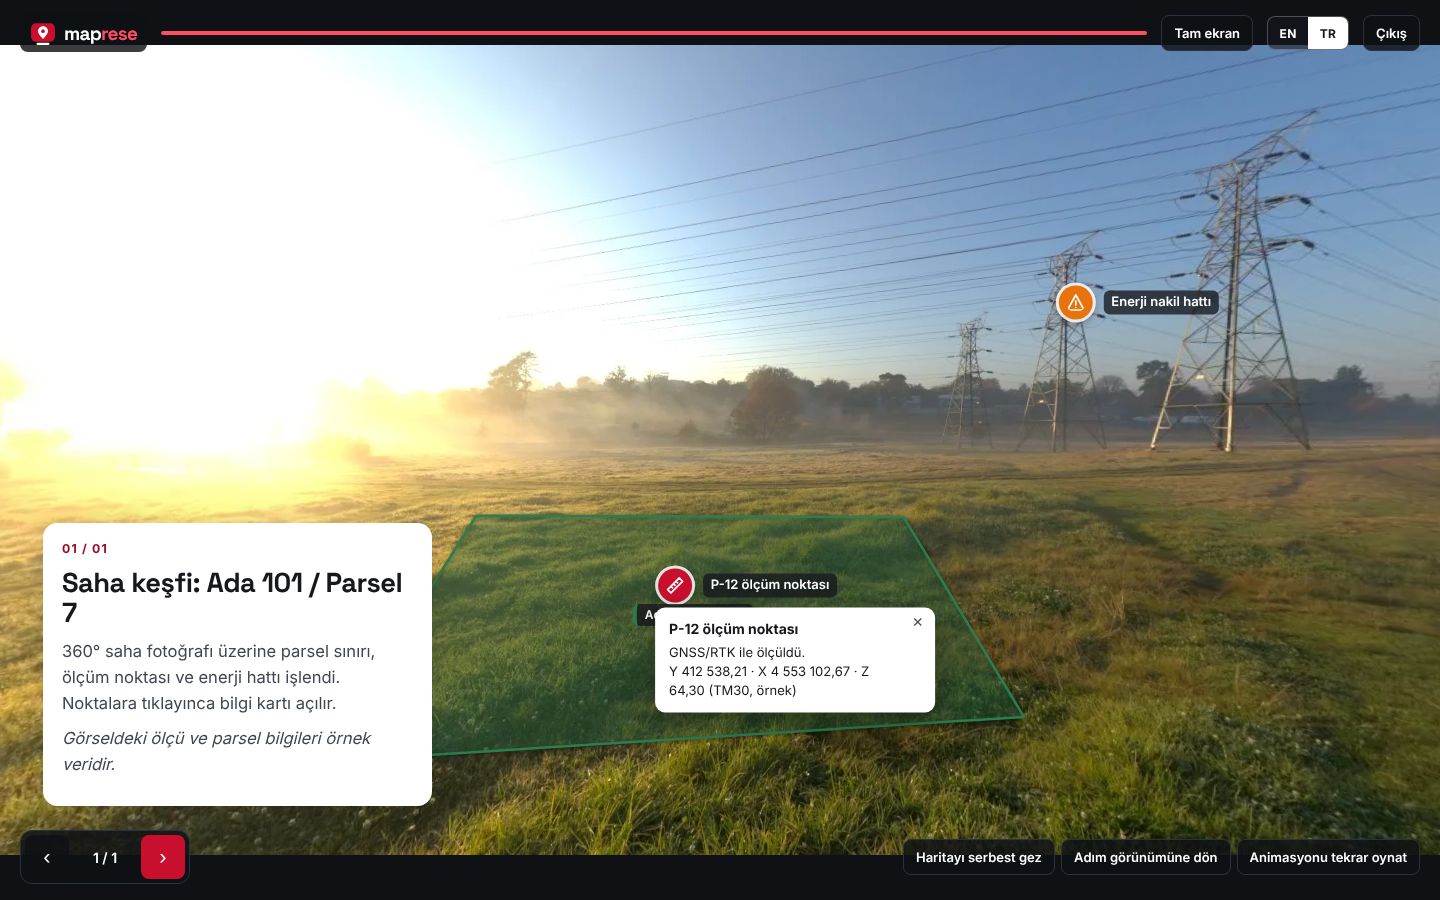
Sunum modunda 360° saha fotoğrafı: yeşil parsel alanı, P-12 ölçüm noktasının bilgi kartı ve enerji nakil hattı uyarısı
Sunum modu: P-12 noktasına tıklanınca koordinatlar açılıyor; enerji hattı turuncu uyarıyla işaretli.
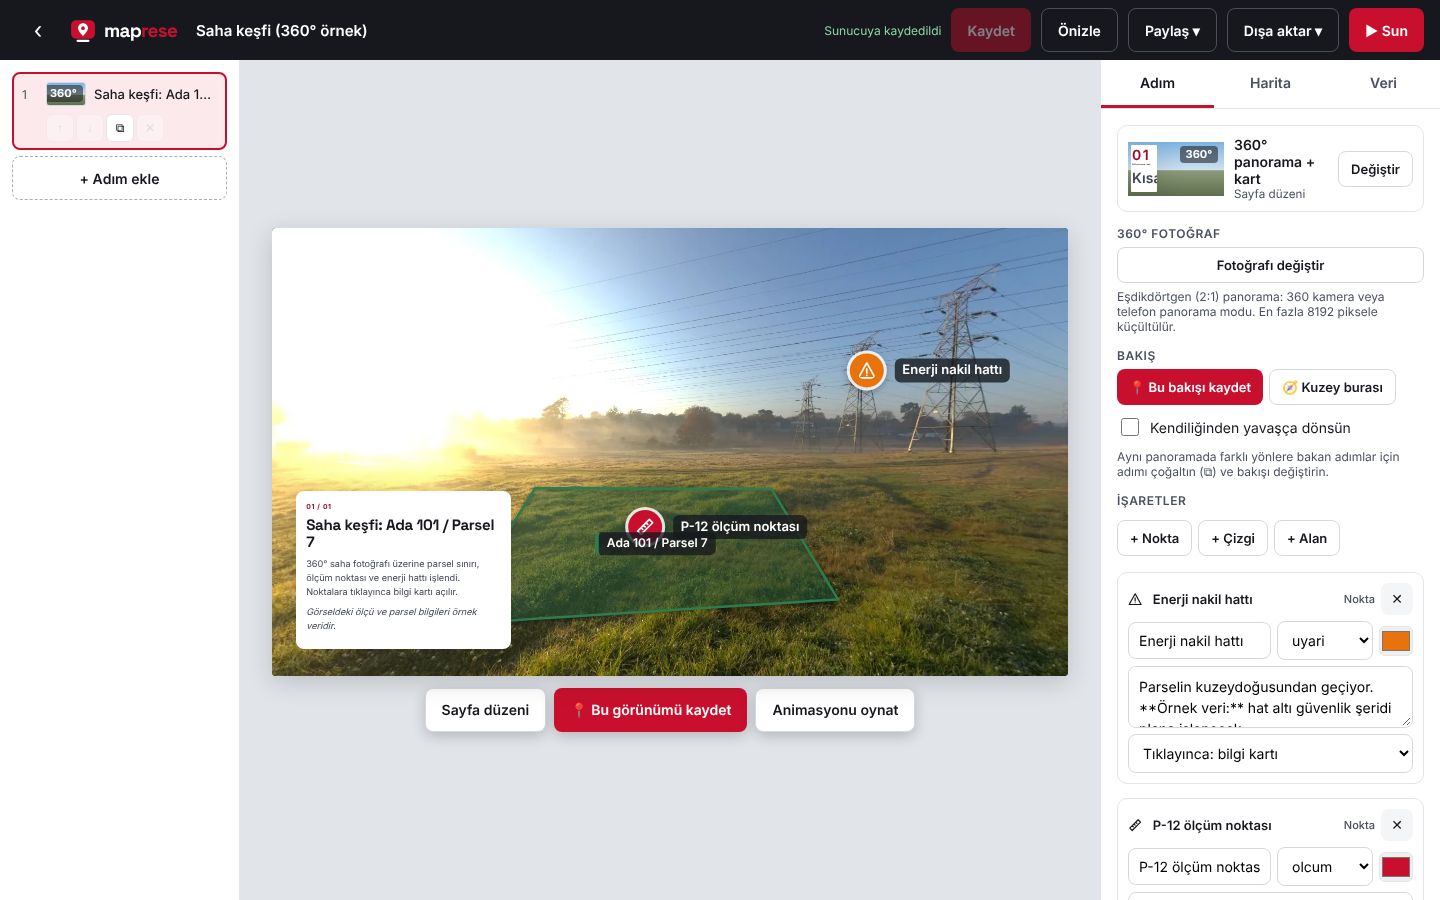
Düzenleyicide 360° panorama paneli: bakış kaydetme, nokta, çizgi ve alan ekleme düğmeleri ve işaret listesi
Düzenleyici: + Nokta, + Çizgi, + Alan ile fotoğrafa çizin; her işarete ikon, renk ve açıklama verin.

Nokta, çizgi, alan

Ölçüm noktası, yol, hat ve parsel sınırını fotoğrafın üstüne çizin; 37 ikon ve renk seçeneği.

Bilgi kartı

Noktaya tıklayınca açıklama, koordinat ya da not açılır; kalın ve italik yazı desteklenir.

Sanal tur

Noktaları başka bakışlara ve sayfalara bağlayın; izleyen saha içinde adım adım gezer.

Konum ve Street View

Fotoğraftaki GPS konumu okunur; mini harita bakış yönünü gösterir, aynı yer tek tıkla Street View’da açılır.

▶ 360° örneğini açın Üye olmadan izleyin · Fotoğraf: Poly Haven (CC0), ölçü ve parsel bilgileri örnek veridir.

ÖZELLİKLER

Haritayı anlatmak için gereken her şey

Animasyonlar

Uçarak geçiş, etrafında dönme, rotanın çizilmesi, seçili yeri nabız efektiyle vurgulama.

Koordinat dönüşümü

ITRF96 TM27/30/33/36, UTM 35/36 ve ED50 koordinatlı dosyalar haritaya oturur.

34 sayfa düzeni

Kapak, yan metin, zaman çizelgesi, istatistik, grafik, tablo, önce/sonra, 360° ve dahası.

360° panorama sayfası

Saha fotoğrafının üstüne nokta, çizgi ve alan çizin; noktalarla sanal tur kurun.

Tablo ve grafik

Ada/parsel listeleri, mesafe tabloları, çubuk ve pasta grafikler haritanın yanında.

3B binalar

Parselleri planlanan kat sayısına göre yükseltin; kamera eğilip döner.

Logo ve 37 ikon

Kurum logonuz her sayfada; ikonlar noktalara, listelere ve tablolara eklenir.

3B model ve Street View

Sketchfab modelini slayta gömün; o konumu tek tıkla Street View’da açın.

Taslak bilgisayarınızda

Çalışırken değişiklikler cihazınızda kalır; “Kaydet” deyince yayına alınır.

Özel veya herkese açık

Sunumlar özel başlar; isterseniz linke sahip herkes görür, kimse değiştiremez.

Türkçe ve İngilizce

Arayüz tarayıcının diline göre açılır; içerik her dilde yazılabilir.

Telefonda da çalışır

Link ile açılan hikâye telefonda kaydırarak izlenir; kurulum gerekmez.

KİMLER İÇİN

Haritaya ihtiyaç duyan herkes için
360° saha fotoğrafı üzerinde parsel ve ölçüm noktası

Harita mühendisleri ve saha ekipleri

TM30 ölçüm noktalarını, GNSS izlerini ve parselleri müşteriye anlaşılır bir sunumla teslim edin.

Örnek: Ada 101 aplikasyon çalışması — ölçüm tablosu ve 360° saha fotoğrafı

Önce/sonra karşılaştırması ve 3B parseller

Kentsel dönüşüm ve belediyeler

Hak sahiplerine projeyi parsel parsel anlatın: mevcut durum, planlanan bloklar, takvim.

Örnek: [Mahalle] dönüşüm projesi — önce/sonra, kat yükseltme, zaman çizelgesi

GPX yürüyüş rotası

Rehberler, gezi yazarları, turizm

Yürüyüş rotasını GPX’ten çizin, duraklara fotoğraf ve video ekleyin, blogunuza gömün.

Örnek: Sultanahmet’ten Galata’ya — 3,9 km, 52 dakika

Numaralı duraklar listesi ve harita

Emlak ve proje satış

Konumu, çevredeki okulları, ulaşımı ve manzarayı tek linkte anlatın; ilan sayfanıza ekleyin.

Örnek: [Proje adı] — metro, okul ve sahil mesafeleri

Tarih zaman çizelgesi

Öğretmenler ve öğrenciler

Tarih ve coğrafya konularını haritada adım adım anlatın; ödev olarak hikâye hazırlatın.

Örnek: İstanbul’un kısa tarihi — 330’dan 1856’ya

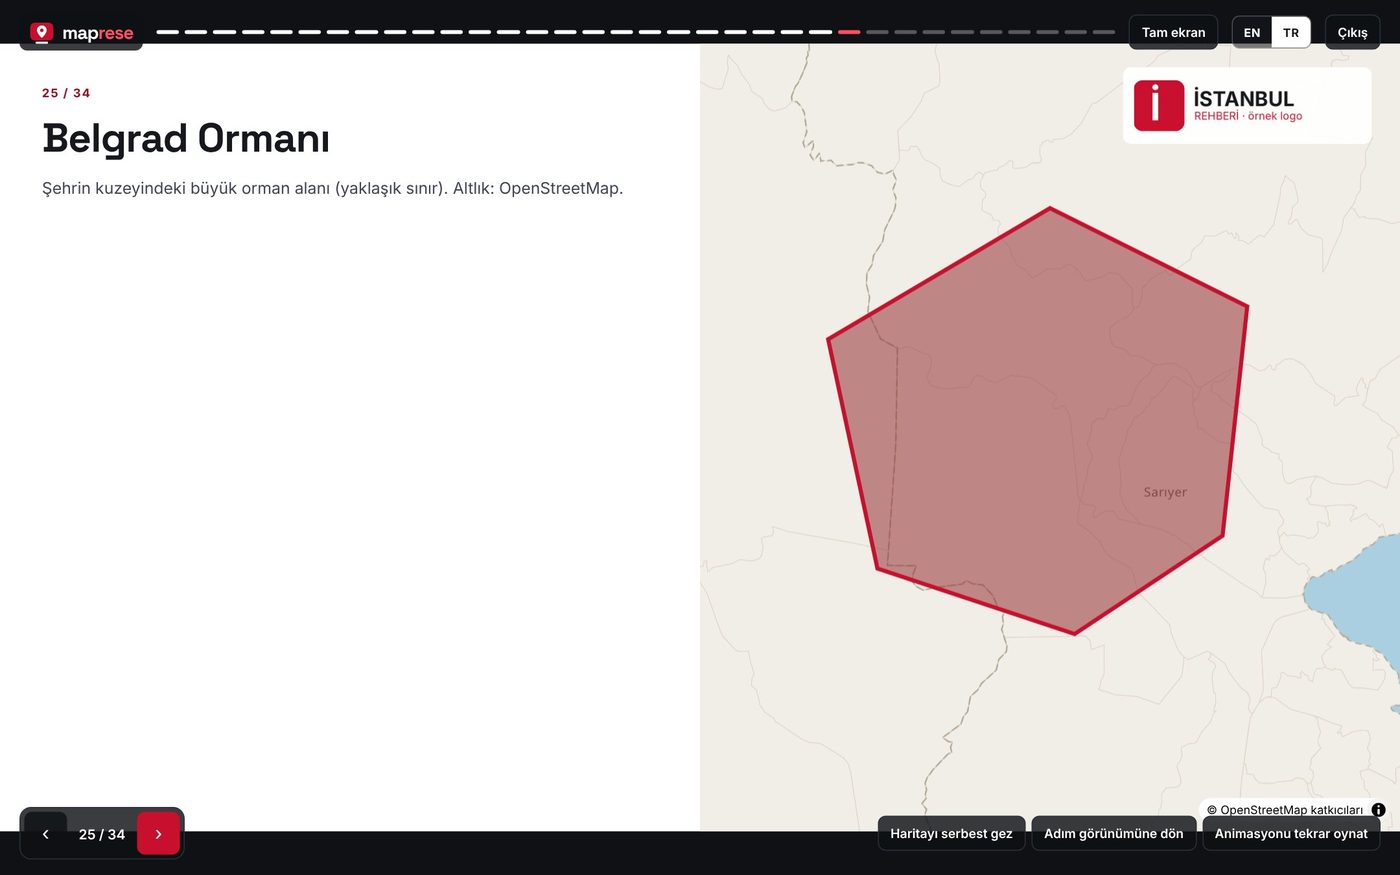
Belgrad Ormanı alanı

Etkinlik ve spor organizatörleri

Koşu, bisiklet ve doğa yürüyüşü parkurlarını başlangıç, mola ve bitiş noktalarıyla gönderin.

Örnek: Belgrad Ormanı parkuru — giriş, su noktaları, bitiş

CANLI ÖRNEK

İstanbul: iki kıtanın hikâyesi

Boğaz, köprüler, tarihi yarımada ve bir GPX yürüyüşü. Bütün özellikleri 34 sayfada gösteren örnek; üye olmadan izleyin, beğenirseniz hesabınıza kopyalayıp düzenleyin.

Örneği açın →
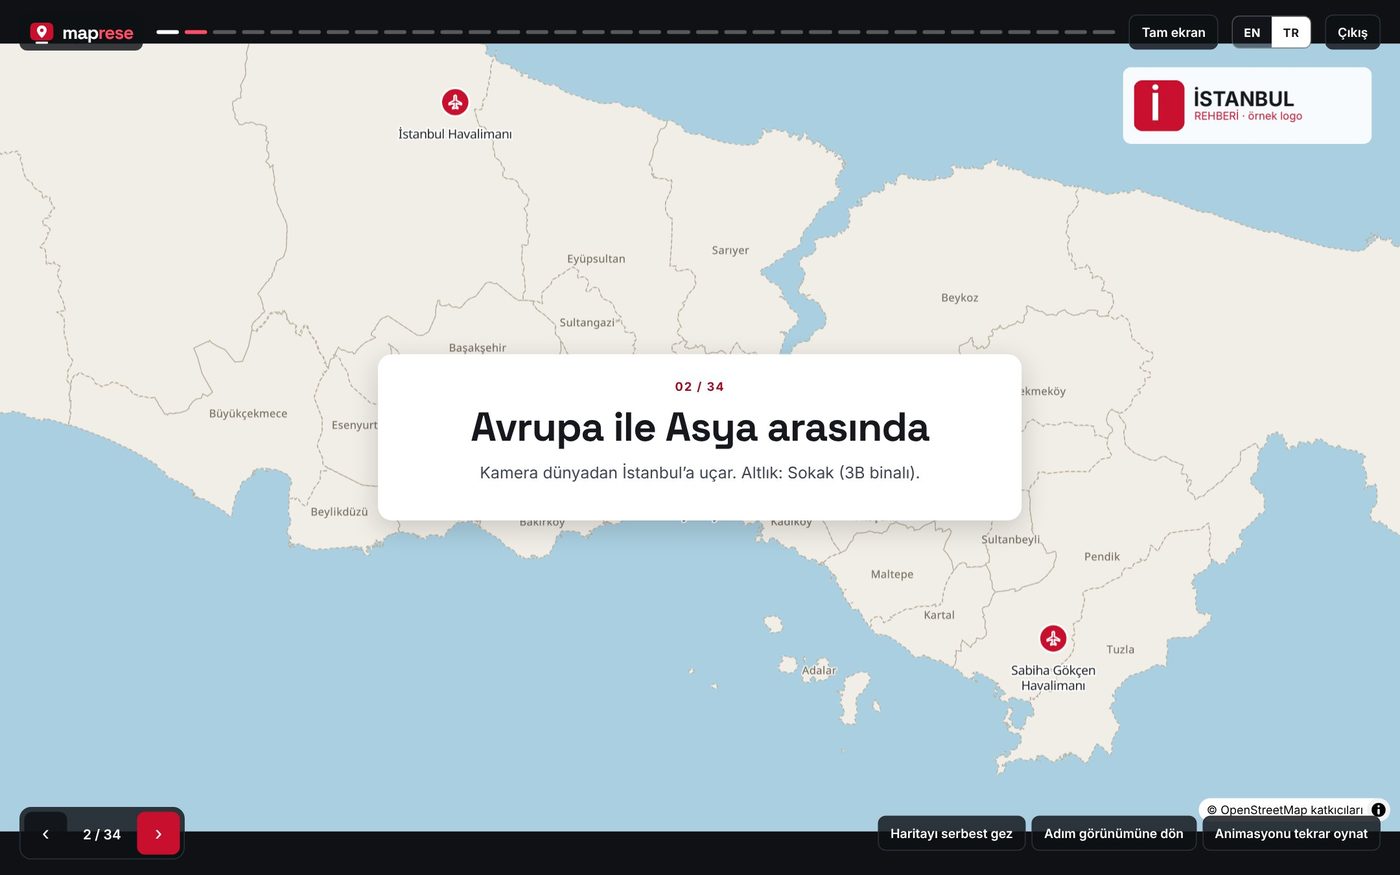
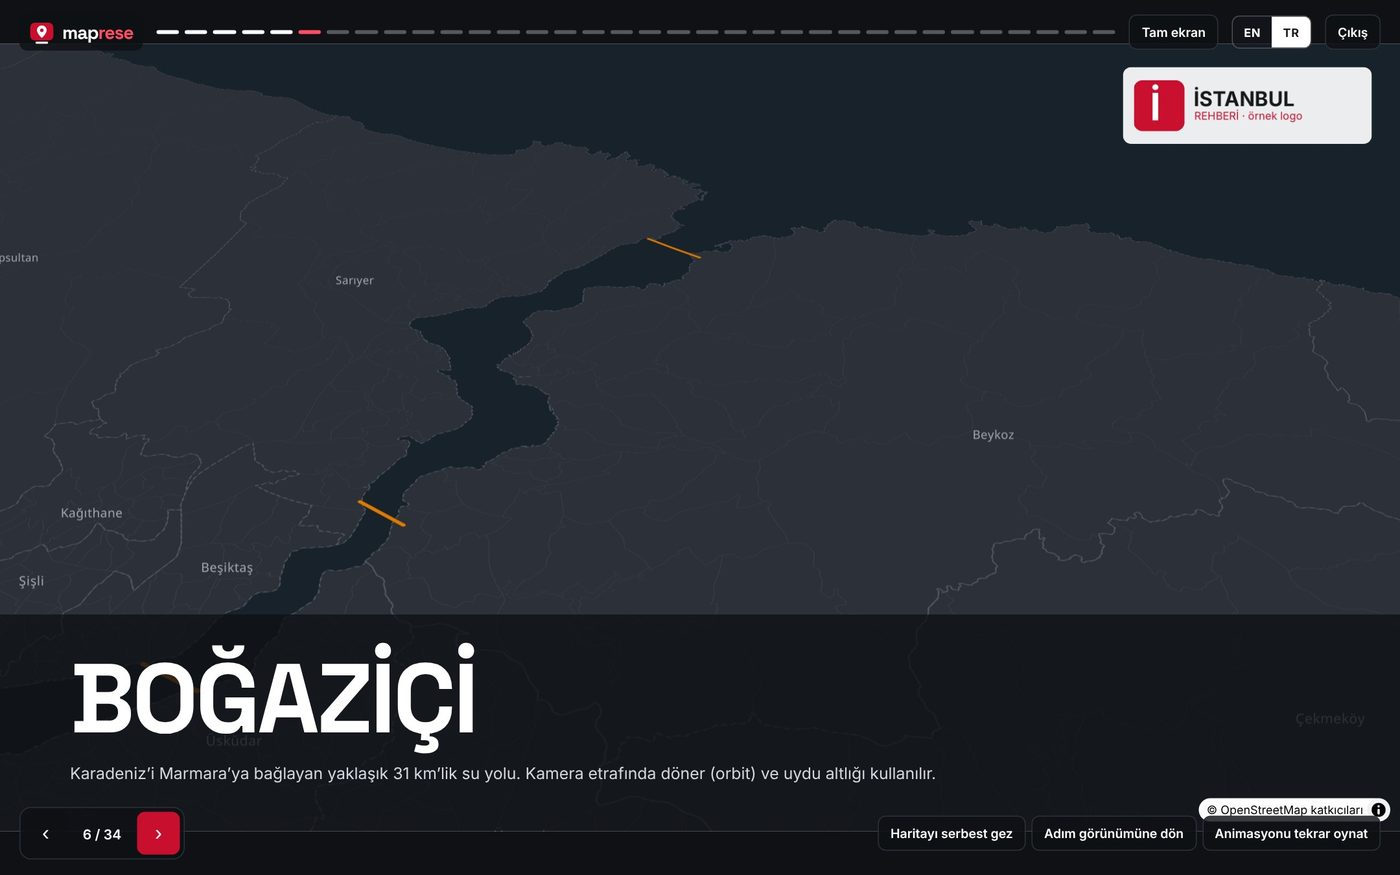
Avrupa ile Asya arasında kapak sayfası BOĞAZİÇİ sayfası Tüm katmanlar ve lejant Boğaz geçişleri zaman çizelgesi

Sık sorulanlar

Ücretli mi?

Ücretsiz hesapla başlayabilirsiniz; üye başına 200 MB depolama. Kurumsal kullanım: [PAKET VE FİYAT BİLGİSİ].

Hangi dosyaları yükleyebilirim?

GPX, KML/KMZ, GeoJSON, CSV, sıkıştırılmış Shapefile; JPG/PNG/WebP fotoğraf, MP4/WebM video, 360° panorama. DXF ve Netcad desteği yolda.

Sunumlarımı kim görebilir?

Yeni sunumlar özeldir. “Linke sahip herkes görüntüleyebilir” derseniz link açılır; görüntüleyenler değiştiremez. Paylaşımı istediğiniz an kapatabilirsiniz.

İnternetsiz sunum yapabilir miyim?

PowerPoint ve PDF internetsiz çalışır. Canlı harita (link, sunum, HTML) harita altlığı için internet ister.

CBS bilgisi gerekiyor mu?

Hayır. Dosyayı ekleyip sayfa düzeni seçmeniz yeterli; gerekirse koordinat sistemini listeden seçersiniz.

İlk harita hikâyenizi bugün hazırlayın.

Google, Outlook veya e-posta ile birkaç saniyede üye olun.

Ücretsiz başlayın
maprese
Sign in Start for free

Map-based stories and presentations

Turn your data into a live map presentation.

A GPX track, KML, CSV, Shapefile or your own drawings… Build a map story that moves step by step; share it as a link, present it full screen, download PowerPoint/PDF or embed it on your website.

Create a free account ▶ Watch the Istanbul example

Nothing to install · Runs in the browser · No GIS skills needed

The Maprese editor: step list on the left, a map of Istanbul with a GPX walking route from Sultanahmet to Galata in the middle, step settings on the right
Real screen: the Istanbul example, step 15. The route comes from a GPX file (3.9 km, ~52 min).
What you can upload: GPXKML / KMZGeoJSONCSV (lat/lon, X/Y)Shapefile (zip)TM27/30/33/36 · UTM · ED50Photos · Video360° panoramasXYZ / WMS services

No more pasting map screenshots into slides.

To explain a place, we take a screenshot, paste it into a slide and draw the arrows by hand. In Maprese the map is the presentation: every page remembers its own camera, layers and animation.

The Bosphorus cruise page in presentation mode: the ferry route from Eminönü to Rumeli Kavağı, the bridges and an info card
Presentation mode: the Bosphorus cruise route draws itself on screen; bridges are marked in orange.
1

A live map, not a still image

Viewers zoom in, see the layers and watch the route being drawn. The same data, from a different angle on every page.

2

No GIS skills needed

Drop the file and pick the coordinate system; even TM30 survey points land on the map by themselves.

3

Make it once, use it everywhere

Link, full-screen presentation, PowerPoint, PDF, website embed and single-file HTML: all from the same story.

HOW IT WORKS

A map presentation in three steps

Map of Istanbul with several data layers and an automatic legend
1

Add your data

Drop your GPX, KML, CSV or SHP file, or draw on the map. The legend builds itself from the visible layers.

Numbered list and map layout: six stops on the Historic Peninsula
2

Set up the pages

Each step starts blank; pick one of 34 layouts, save the camera view and turn on animation.

Ferry lines page: routes between Eminönü, Karaköy, Kadıköy and Üsküdar piers
3

Share, present, download

Send the link, present in a meeting, export PowerPoint/PDF or embed it on your own site.

ONE STORY, SIX OUTPUTS

Fits wherever you need to tell it

No need to rebuild the story: a presentation for the meeting, a link for the client, a PDF for the tender, a live map for your website.

A GPX walk viewed by scrolling on a phone

Live link

A map story that advances as you scroll, phones included. Viewers need no account and cannot change it.

A dark full-screen map page titled BOĞAZİÇİ

Full-screen presentation

Step through with the arrow keys; the camera flies, routes draw, and you can explore freely when questions come.

Eight pages from the PDF export of the Istanbul example

PowerPoint and PDF

One slide per step; text also goes into PowerPoint notes. For tenders, report appendices and printing.

A Maprese map embedded in a travel blog post

Embed on your website

Paste the code into your site, blog or listing; when you update the story, the map on your site updates too.

Cover page titled Between Europe and Asia

Single-file HTML

Photos and data inside; host it on your own server or send it by email.

Timeline page of Bosphorus crossings

Screenshot (PNG)

Download any page as an image: social media, report covers, messaging.

Which output when?

OutputIs the map interactive?Needs internet?Best for
Live linkYesYesSending to clients, teams, social media
Full-screen presentationYesYesMeetings, classes, site briefings
Website embedYesYesWebsites, blogs, project pages
HTML fileYesYes, for the basemapYour own server, archives, sharing without an account
PowerPointNo (images)NoCorporate decks, merging with other slides
PDFNoNoTenders, report appendices, printing
PNG imageNoNoSocial media, cover images, messaging

WITH REAL DATA

Numbers, tables and charts next to the map

The pages below come from the Istanbul example, with their sources. Type your own table; the layout does the rest.

Istanbul in numbers: population 15,754,053, 2,943 people per km², 39 districts, about 381 km of rail
Stat cards + mapPopulation 15,754,053 and 2,943 people per km² (TurkStat ABPRS, 31.12.2025), 39 districts, ~381 km of rail (2025).
Bar chart of bridge main spans: 1,074, 1,090 and 1,408 metres
Bar chart + mapMain spans of the Bosphorus bridges: 1,074 m, 1,090 m, 1,408 m.
Table of Bosphorus crossings: bridges, Marmaray and the Eurasia Tunnel
TableFive Bosphorus crossings: type, opening year and what they connect, with icons in the rows.
A short history timeline from 330 to 1856
Timeline330 capital, 537 Hagia Sophia, 1453 conquest, 1478 Topkapı, 1856 Dolmabahçe.
Before/after slider and 3D extruded sample parcels
Before / after + 3D parcelsCurrent and planned state with a slider; parcels rise by floor count (sample data).
Map on top, text below: GPX walk from Sultanahmet to Galata Tower
GPX routeA real walking track: 3.9 km, about 52 minutes; the route draws when the page opens.

360° SITE PHOTOS

Bring the site to the office: draw on a 360° photo

Turn a photo from a 360 camera or your phone’s panorama mode into a presentation page. Draw the parcel boundary, survey points, lines and warnings right on the photo; viewers look around by dragging and click points to open info cards.

A 360° site photo in presentation mode: a green parcel area, the info card of survey point P-12 and a power line warning
Presentation mode: clicking point P-12 shows its coordinates; the power line is marked with an orange warning.
The 360° panorama panel in the editor: save view, add point, line and area buttons and the list of markers
Editor: draw on the photo with + Point, + Line and + Area; give each marker an icon, a colour and a description.

Points, lines, areas

Draw survey points, roads, lines and parcel boundaries on the photo; 37 icons and any colour.

Info cards

Click a point to open a description, coordinates or a note; bold and italic text supported.

Virtual tour

Link points to other views and pages; viewers walk through the site step by step.

Location and Street View

GPS location is read from the photo; a mini map shows the view direction, and the spot opens in Street View in one click.

▶ Open the 360° example No account needed · Photo: Poly Haven (CC0); measurements and parcel data are sample data.

FEATURES

Everything you need to tell a map story

Animations

Fly-to, orbit, route drawing and a pulse effect to highlight a place.

Coordinate conversion

Files in ITRF96 TM27/30/33/36, UTM 35/36 and ED50 land on the map correctly.

34 page layouts

Cover, sidecar, timeline, stats, chart, table, before/after, 360° and more.

360° panorama pages

Draw points, lines and areas on a site photo; link points into a virtual tour.

Tables and charts

Parcel lists, distance tables, bar and pie charts right next to the map.

3D buildings

Extrude parcels by planned floor count; tilt and rotate the camera.

Logo and 37 icons

Your logo on every page; icons for points, lists and tables.

3D models and Street View

Embed a Sketchfab model in a slide; open the spot in Street View with one click.

Drafts on your computer

Changes stay on your device while you work; they go live when you press Save.

Private or public

Stories start private; optionally anyone with the link can view, nobody can edit.

English and Turkish

The interface follows the browser language; write your content in any language.

Works on phones

Shared stories scroll nicely on a phone; nothing to install.

WHO IT’S FOR

For anyone who needs a map

Parcel and survey point on a 360° site photo

Surveyors and field teams

Deliver TM30 survey points, GNSS tracks and parcels to clients as a clear presentation.

Example: Block 101 stake-out — survey table and 360° site photo

Before/after comparison and 3D parcels

Urban renewal and municipalities

Explain the project parcel by parcel: current state, planned blocks, schedule.

Example: [Neighbourhood] renewal project — before/after, floor heights, timeline

GPX walking route

Guides, travel writers, tourism

Draw the walk from a GPX file, add photos and video at each stop, embed it in your blog.

Example: Sultanahmet to Galata — 3.9 km, 52 minutes

Numbered list of stops and map

Real estate and project sales

Show location, nearby schools, transport and views in one link; add it to your listing.

Example: [Project name] — distances to metro, schools and the shore

History timeline

Teachers and students

Teach history and geography step by step on a map; set map stories as homework.

Example: A short history of Istanbul — from 330 to 1856

Belgrade Forest area

Event and sports organisers

Send running, cycling and hiking courses with start, rest and finish points.

Example: Belgrade Forest course — entrance, water points, finish

LIVE EXAMPLE

Istanbul: a tale of two continents

The Bosphorus, its bridges, the historic peninsula and a GPX walk. Every feature in 34 pages; watch it without an account and copy it to yours if you like it.

Open the example →
Cover page Between Europe and Asia BOĞAZİÇİ page All layers and legend Timeline of Bosphorus crossings

Frequently asked

Is it free?

You can start with a free account with 200 MB of storage. Business use: [PLANS AND PRICING].

Which files can I upload?

GPX, KML/KMZ, GeoJSON, CSV, zipped Shapefile; JPG/PNG/WebP photos, MP4/WebM video, 360° panoramas. DXF and Netcad support is on the way.

Who can see my stories?

New stories are private. Turn on “Anyone with the link can view” to share; viewers cannot edit. You can turn sharing off at any time.

Can I present offline?

PowerPoint and PDF work offline. The live map (link, presentation, HTML) needs internet for the basemap.

Do I need GIS knowledge?

No. Add a file and pick a layout; if needed, choose the coordinate system from a list.

Build your first map story today.

Sign up in seconds with Google, Outlook or email.

Start for free